Flowchart Symbols and Examples with Definition and Diagram
 A flowchart is a type of diagram that represents a process, showing the steps as symbols of various kinds, and their order by connecting them with arrows. The flowchart allows any type of process to represent graphically.
it is made up of different graphics that are used to make different diagrams for various concepts linking to programming for different fields such as education, economics, technological processes, psychology, etc, to required analysis.
This diagrammatic representation can give a step-by-step solution to a given problem. It helps in finding the solution to a problem and facilitate showing the input, process, and output of the problem.
This is a Complete Guide About flowcharts in Excel with diagrams & Examples.
in This Article You’ll Learn:
- What is a Flowchart (Definition)
- Some Examples of Flowchart
- Benefits
- Standard Flowchart Symbols
- Lots more….!
Let’s get started.
What is a Flowchart? (Definition)
Flowcharting or flowchart is a process of pictorial illustration for solving a problem. it is also a form of graphical representation of a certain process or algorithm. the activity diagram or Flowcharting is a tool for analyzing processes. Flowcharting can be used in computer systems design, programming, engineering, and science, etc.
these days flowcharts in using in different technical fields and developing processes such as industrial processes, computer programming, cognitive psychology, and economics.
the flowchart can explain graphical representations with the help of geometrical figures. each image used in the flowchart is a step-by-step execution of plans according to specified meanings connecting with each other through different types of arrows to make the direction flow.
Benefits of flowchart:
- It helps in understanding the logic of the problem-solving processes.
- It gives a pictorial representation of the processes involved in the problem solution.
- It shows the flow processes in a sequential manner.
Standard Flowchart Symbols
Flowcharting uses standardized sets of symbols. The main symbols used in a flow chart with their description and examples are given in the following table.
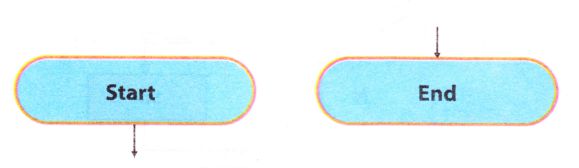
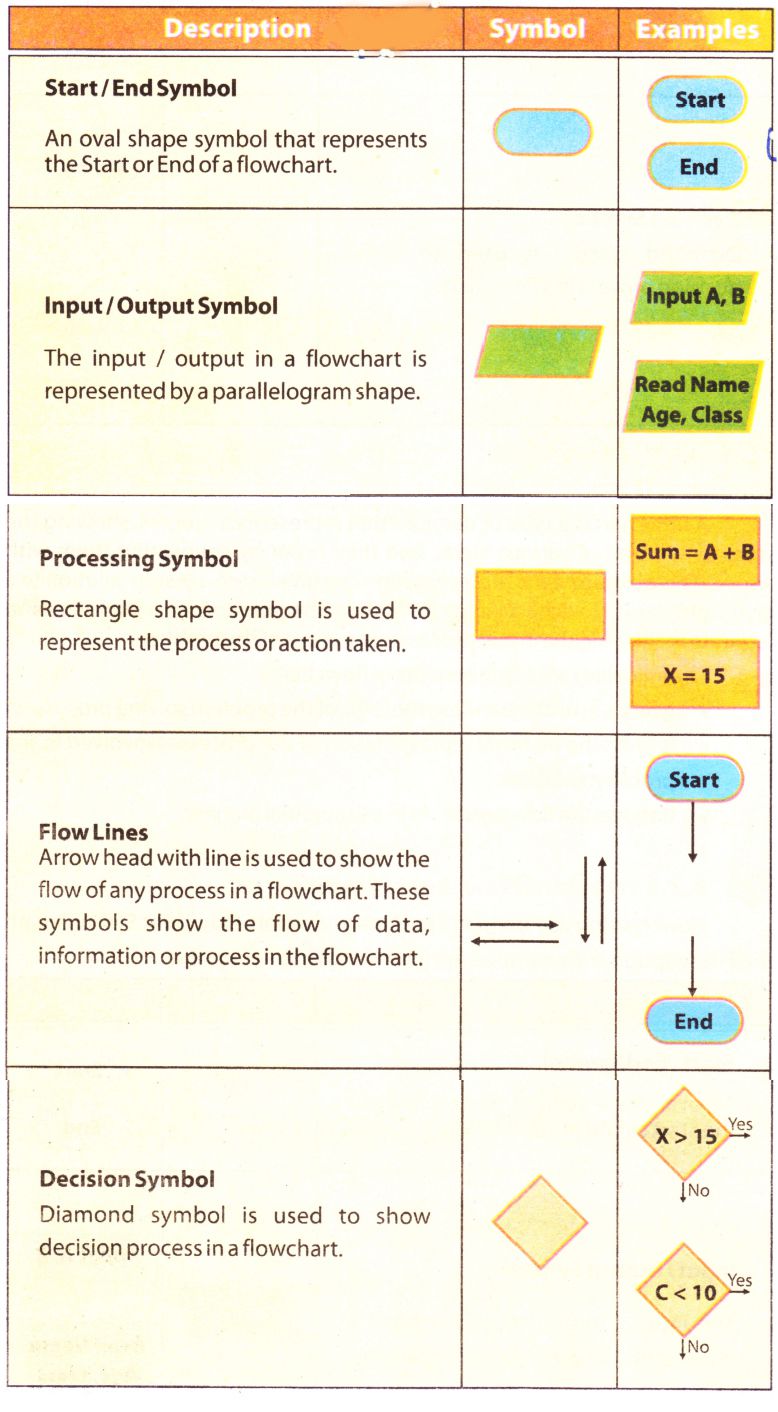 Diagram start
- Start the activity or input
- Controlling activity
- The connection between parts through arrows
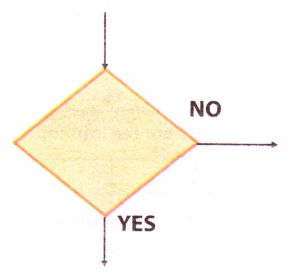
- Decision making Symbols
- Flow
Guidelines for Flowcharting
Following guidelines should be followed while drawing a flowchart:
- It should be clear, neat, and easy to follow.
- the Flow of the flowchart is either from left to right or from top to bottom.
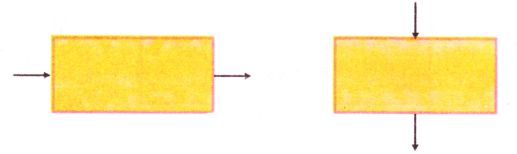
- Only one flow line should enter and come out of the process symbol.
- Only one flow line should enter a decision symbol, but two flow lines could come out, one for each possible answer, should leave the decision symbol.
- Only one flow line is used to Start / End the symbol.
- Avoid the intersection of flow lines to make it more effective.
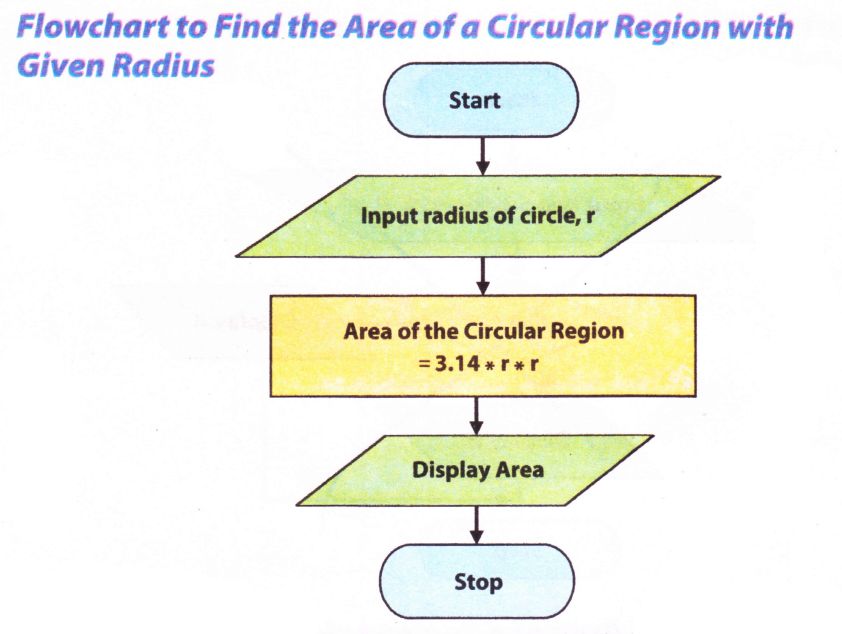
Examples of Flowchart
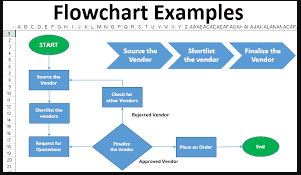
Some samples given to solve some simple problems are given as follows: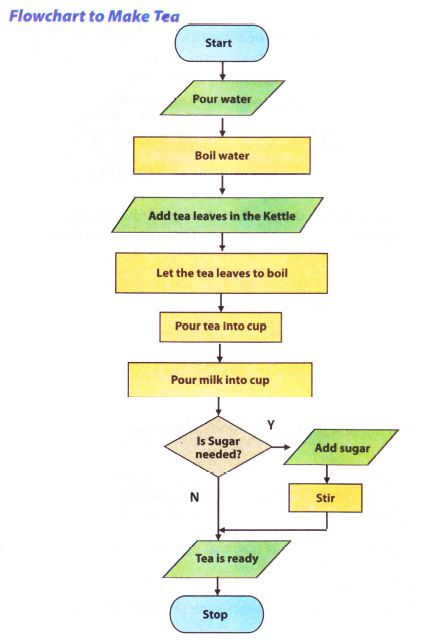
Types of Flowchart
there are different types of flowcharts depending upon to serve different purposes. some are process-based.
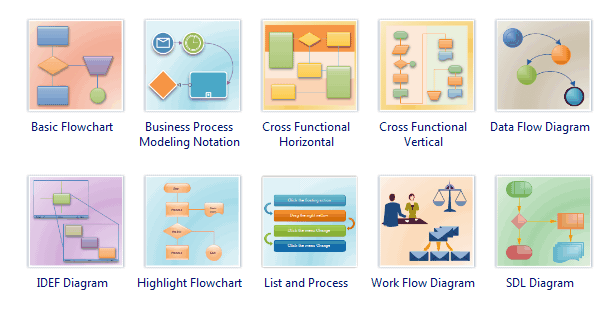
basically, there are four basic types of a flowchart when you orient your presentation in it which are as follows:
- Horizontal: it is the most common orientation model or style and starts from right to left as of their reading order.
- Panoramic: it can represent an entire process on a single sheet by using verticle and horizontal modes.
- Vertical: the operations go from top to bottom in this type of illustration.
- Architectural: Architectural describes a person’s work itinerary on the based of work area.
Putting Products or materials in the Flowchart
when the sample of the elements of a given product or material is used in the flowchart, is known as a product flowchart.
Putting different Operations in the flow chart
in this type of flow chart, a person carries out a sequence of operations.
Functional flow diagram
the Functional flow diagram is represented always graphically where dependencies or people handle a specific process. it is also an efficient process as compared to others.
Horizontal format flowchart
in this type of flow chart, different operations are arranged from left to right sequence.
Vertical format flowchart
in this type of flow chart, different operations are arranged from top to bottom sequence.
In a widescreen flow chart
of this type, the whole process is presented on a single-letter flowchart. it is a very famous type.
Block flow diagram
in this type, the flow of the products are represented in a block manner, where the products are in different quantities and
Architectural Format Flow Chart
This type of format is used to describe products as having some form of road structure or also about a construction project for a person who has a certain work area.
Computer or data flow diagram
This type of view illustrates a method in a graphic way when you need to solve a problem.
Geographical flow diagram
This flow chart for a geographical or physical plan is what physically analyzes all activities in the process. At the same time, it is less time-consuming as production continues and resources are diverted to other activities.
Rules for making a flow chart
Before starting to make a flow diagram you must follow some rules and steps for better elaboration and 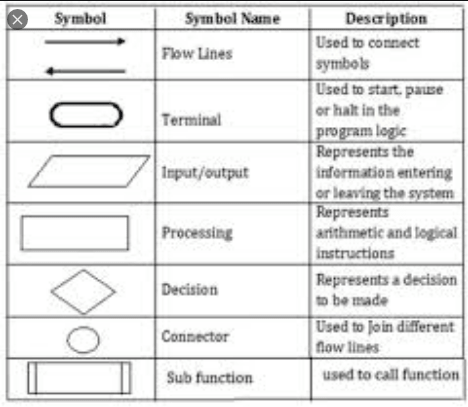 consideration which are as follows:
- Identify first the main tasks of the whole process along with its context and author.
- always place return lines under the Flow diagram
- Identify who will read it and what status of mind he has.
- Define the major objectives that it will pursue.
- always flow data from left to right.
- must choose a level of detail and the limits regarding the flowchart for better understanding.
- Keeping the whole thing on a single page.
- not to use Traditional Decision Symbols instead of Split Paths.
FAQs (Frequently Asked Questions)
How do you create a process flow chart?
creating a flowchart depends on the following steps:
- Click the File tab
- Click New
- Flowchart
- click Basic from Available Templates
- Create
- drag a flowchart shape for each step
- Connect the flowchart shapes to each other with arrows and lines
What is a flowchart example?
the flowchart diagram is an example of a workflow or process representation of an algorithm. in this process, you follow a step-by-step approach to solve a problem. it includes different types of arrows, boxes, shapes, and symbols which are connected with each other through lines and arrows.
What are the 8 basic symbols of the flowchart?
the 8 basic symbols of the flowchart are as follows:
- Start/End Symbol
- Manual Input Symbol
- Multiple Documents Symbol
- Or Symbol
- Manual Loop Symbol
- Collate Symbol
- Display Symbol
- Stored Data Symbol
What are flowchart symbols?
in flowchart symbols, some or common while others are action symbols. common are used most o the time frequently. in the action symbols, often an action, process, or function is described.
Which symbol is used for processing?
the action symbol is used for processing.
How many symbols are commonly used in flow charts?
there are 28 different Flowchart Symbols are there used in common with their meanings.
You May Also Like:
- Difference between Address Bus, Control Bus, and Data Bus
- Difference between First Generation and Second Generation Computers
- Different Types of Computers and Their Classification
- Difference Between Ram and Rom
- Difference Between Microcomputer and Minicomputer
- Spreadsheet Basic Elements
- Operating System Working
- Organize, Move and Delete Window7 Desktop Icons